Using the Tesla API to track my Model 3 in Real Time
In this post I’m going to show you how I tracked the location of my Tesla Model 3 in real time and plotted it on a map. I walk through an end to end integration of requesting data from the car, streaming it into a Kafka Topic and using Rockset to expose the data via its API to create real time visualisations in D3.
Getting started with Kafka
When starting with any new tool I find it best to look around and see the art of the possible. Within the Rockset console there’s a catalog of out of the box integrations that allow you to attach Rockset to any number of existing applications you may have. The one that immediately caught my eye was the Apache Kafka integration.
This integration allows you to take data that is being streamed into a Kafka topic and make it immediately available for analytics. Rockset does this by consuming the data from Kafka and storing it within its analytics platform almost instantly, so you can begin querying this data right away.
There are a number of great posts that outline in detail how the Rockset and Kafka integration works and how to set it up but I’ll give a quick overview of the steps I took to get this up and running.
Setting up a Kafka Producer
To get started we’ll need a Kafka producer to add our real time data onto a topic. The dataset I’ll be using is a real time location tracker for my Tesla Model 3. In Python I wrote a simple Kafka producer that every 5 seconds requests the real time location from my Tesla and sends it to a Kafka topic. Here’s how it works.
Firstly we need to setup the connection to the Tesla. To do this I used the Smart Car API and followed their getting started guide. You can try it for free and make up to 20 requests a month. If you wish to make more calls than this there is a paid option.
Once authorised and you have all your access tokens, we can use the Smart Car API to fetch our vehicle info.
vehicle_ids = smartcar.get_vehicle_ids(access['access_token'])['vehicles']

# instantiate the first vehicle in the vehicle id list
vehicle = smartcar.Vehicle(vehicle_ids[0], access['access_token'])

# Get vehicle info to test the connection
info = vehicle.info()
print(info)
For me, this returns a JSON object with the following properties.

   {
        "id": "XXXX",
        "make": "TESLA",
        "model": "Model 3",
        "year": 2019
    }
Now we’ve successfully connected to the car, we need to write some code to request the car’s location every 5 seconds and send that to our Kafka topic.
from kafka import KafkaProducer
# initialise a kafka producer
producer = KafkaProducer(bootstrap_servers=['localhost:1234'])

while True:
      # get the vehicles location using SmartCar API
    location = vehicle.location()
      # send the location as a byte string to the tesla-location topic
    producer.send('tesla-location', location.encode())
    time.sleep(5)
Once this is running we can double check it’s working by using the Kafka console consumer to display the messages as they are being sent in real time. The output should look similar to Fig 1. Once confirmed it’s now time to hook this into Rockset.
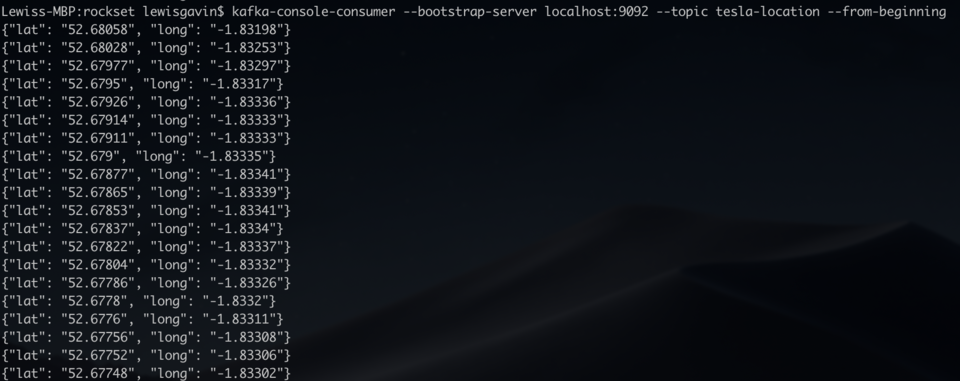 Fig 1. Kafka console consumer output
Streaming a Kafka Topic into Rockset
The team at Rockset have made connecting to an existing Kafka topic quick and easy via the Rockset console.
- Create Collection
- Then select Apache Kafka
- Create Integration - Give it a name, choose a format (JSON for this example) and enter the topic name (tesla-location)
- Follow the 4 step process provided by Rockset to install Kafka Connect and get your Rockset Sink running
It’s really as simple as that. To verify data is being sent to Rockset you can simply query your new collection. The collection name will be the name you gave in step 3 above. So within the Rockset console just head to the Query tab and do a simple select from your collection.
select * from commons."tesla-integration"
You’ll notice in the results that not only will you see the lat and long you sent to the Kafka topic but some metadata that Rockset has added too including an ID, a timestamp and some Kafka metadata, this can be seen in Fig 2. These will be useful for understanding the order of the data when plotting the location of the vehicle over time.
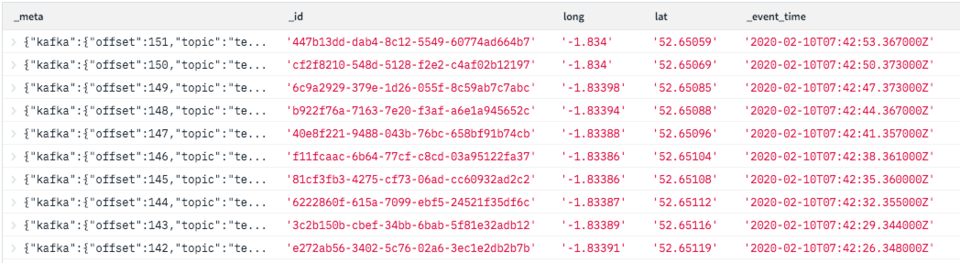 Fig 2. Rockset console results output
Connecting to the REST API
From here, my next natural thought was how to expose the data that I have in Rockset to a front end web application. Whether it’s the real time location data from my car, weblogs or any other data, having this data in Rockset now gives me the power to analyse it in real time. Rather than using the built in SQL query editor, I was looking for a way to allow a web application to request the data. This was when I came across the REST API connector in the Rockset Catalog.
Fig 3. Rest API Integration
From here I found links to the API docs with all the information required to authorise and send requests to the built in API (API Keys can be generated within the Manage menu, under API Keys).
Using Postman to Test the API
Once you have your API key generated, it’s time to test the API. For testing I used an application called Postman. Postman provides a nice GUI for API testing allowing us to quickly get up and running with the Rockset API.
Open a new tab in Postman and you’ll see it will create a window for us to generate a request. The first thing we need to do is find the URL we want to send our request to. The Rockset API docs state that the base address is https://api.rs2.usw2.rockset.com and to query a collection you need to append /v1/orgs/self/queries - so add this into the request URL box. The docs also say the request type needs to be POST, so change that in the drop down too as shown in Fig 4.
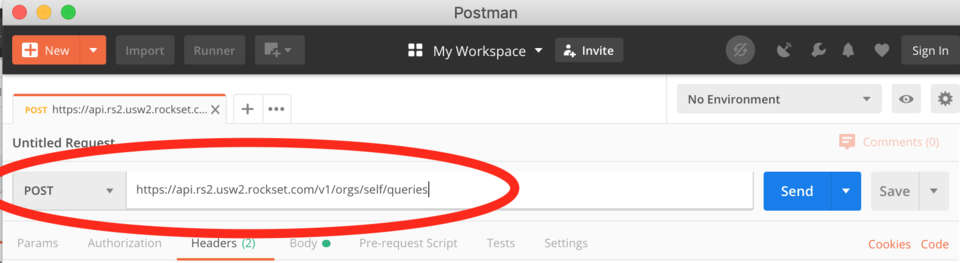 Fig 4. Postman setup
We can hit send now and test the URL we have provided works. If so you should get a 401 response from the Rockset API saying that authorization is required in the header as shown in Fig 5.
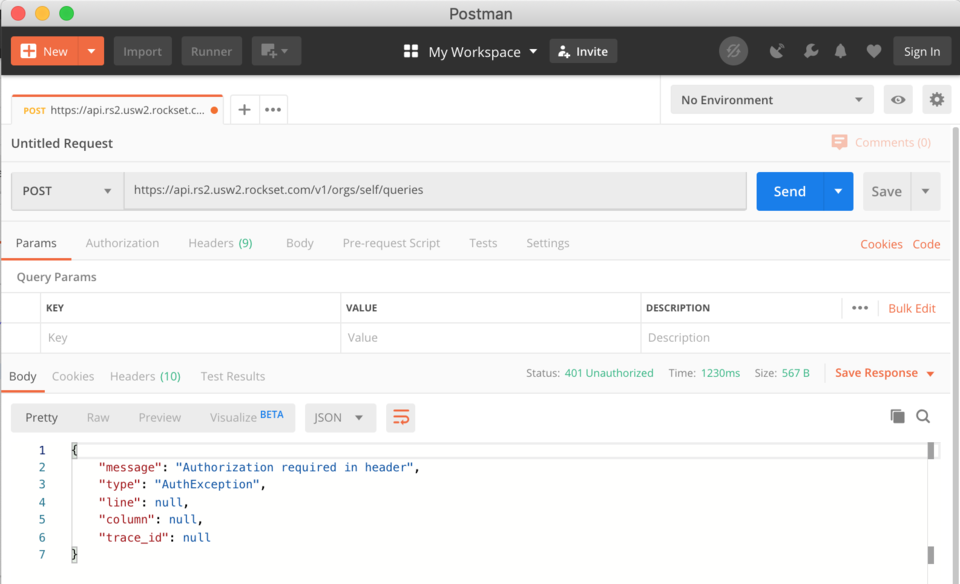 Fig 5. Auth error
To resolve this, we need the API Key generated earlier. If you’ve lost it, don’t worry as it’s available in the Rockset Console under Manage > API Keys. Copy the key and then back in Postman under the “Headers” tab we need to add our key as shown in Fig 6. We’re essentially adding a key value pair to the Header of the request. It’s important to add ApiKey to the value box before pasting in your key (mine has been obfuscated in Fig 6.) Whilst there, we can also add the Content-Type and set it to application/json.
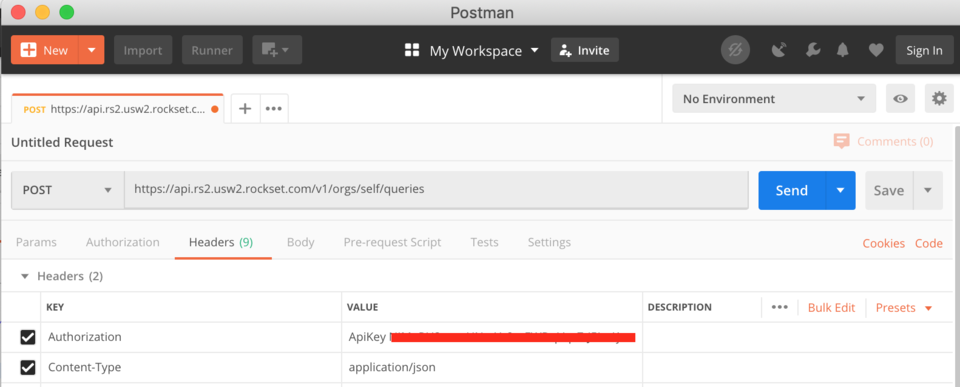 Fig 6. Postman authorization
Again, at this point we can hit Send and we should get a different response asking us to provide a SQL query in the request. This is where we can start to see the benefits of using Rockset as on the fly, we can send SQL requests to our collection that will rapidly return our results so they can be used by a front end application.
To add a SQL query to the request, use the Body tab within Postman. Click the Body tab, make sure ‘raw’ is selected and ensure the type is set to JSON, see Fig 7 for an example. Within the body field we now need to provide a JSON object in the format required by the API, that provides the API with our SQL statement.
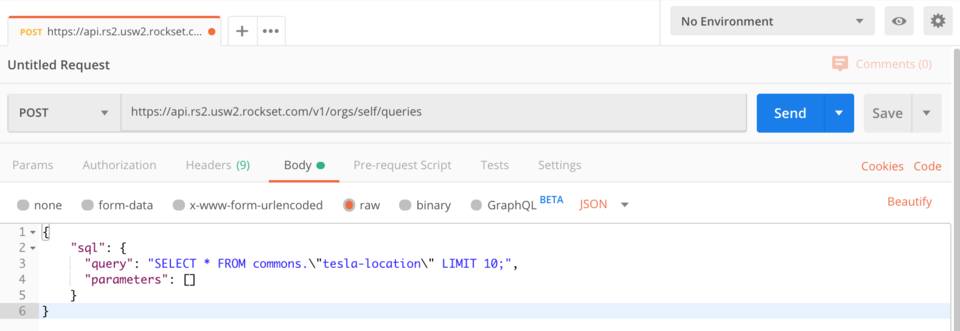 Fig 7. Postman raw body
As you can see in Fig 7 I’ve started with a simple SELECT statement to just grab 10 rows of data.
{
    "sql": {
       "query": "select * from commons.\"tesla-location\" LIMIT 10",
       "parameters": []
     }
}
It’s important you use the collection name that you created earlier and if it contains special characters, like mine does, that you put it in quotes and escape the quote characters.
Now we really are ready to hit send and see how quickly Rockset can return our data.
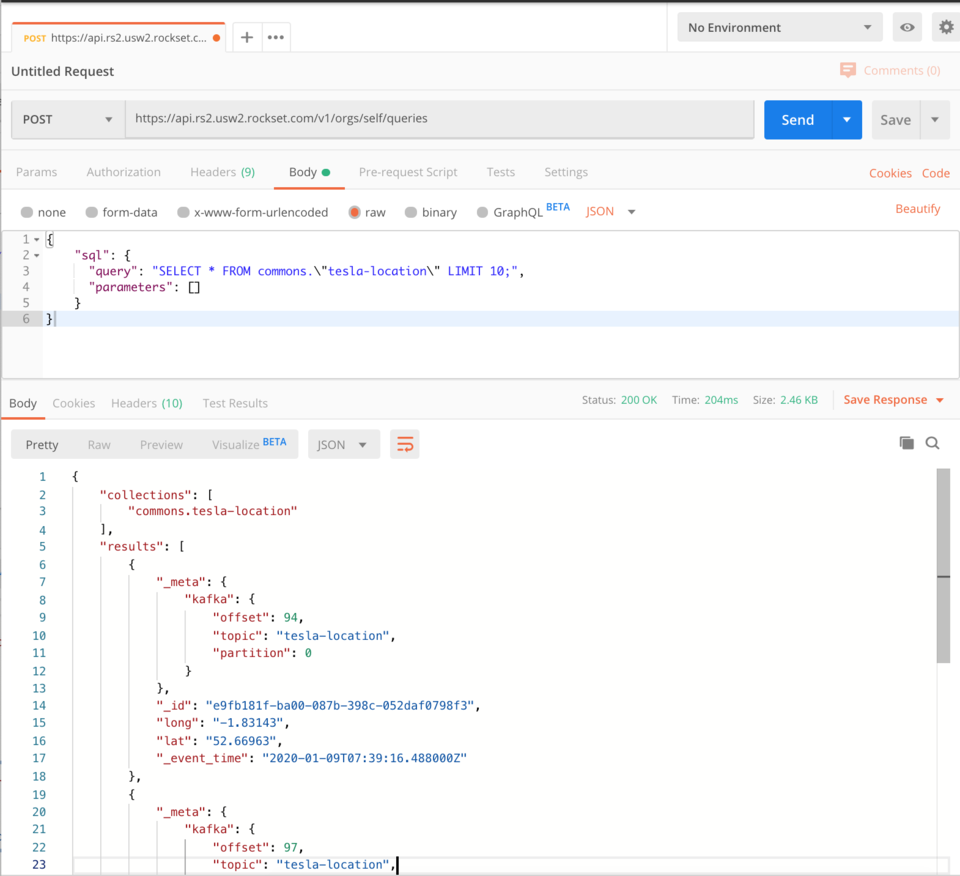 Fig 8. Rockset results
Fig 8 shows the results returned by the Rockset API. It provides a collections object so we know which collections were queried and then an array of results, each containing some Kafka metadata, an event ID and timestamp, and the lat long coordinates that our producer was capturing from the Tesla in real time. According to Postman that returned in 0.2 seconds which is perfectly acceptable for any front end system.
Of course, the possibilities don’t stop here, you’ll often want to perform more complex SQL queries and test them to view the response. Now we’re all set up in Postman this becomes a trivial task. We can just change the SQL and keep hitting send until we get it right.
Visualising Data using D3.js
Now we’re able to successfully call the API to return data, we want to utilise this API to serve data to a front end. I’m going to use D3.js to visualise our location data and plot it in real time as the car is being driven.
The flow will be as follows. Our Kafka producer will be fetching location data from the Tesla every 3 seconds and adding it to the topic. Rockset will be consuming this data into a Rockset collection and exposing it via the API. Our D3.js visualisation will be polling the Rockset API for new data every 3 seconds and plotting the latest coordinates on a map of the UK.
The first step is to get D3 to render a UK map. I used a pre-existing example to build the HTML file. Save the html file in a folder and name the file index.html. To create a web server for this so it can be viewed in the browser I used Python. If you have python installed on your machine you can simply run the following to start a web server in the current directory.
python -m SimpleHTTPServer
By default it will run the server on port 8000. You can then go to 127.0.0.1:8000 in your browser and if your index.html file is setup correctly you should now see a map of the UK as shown in Fig 9. This map will be the base for us to plot our points.
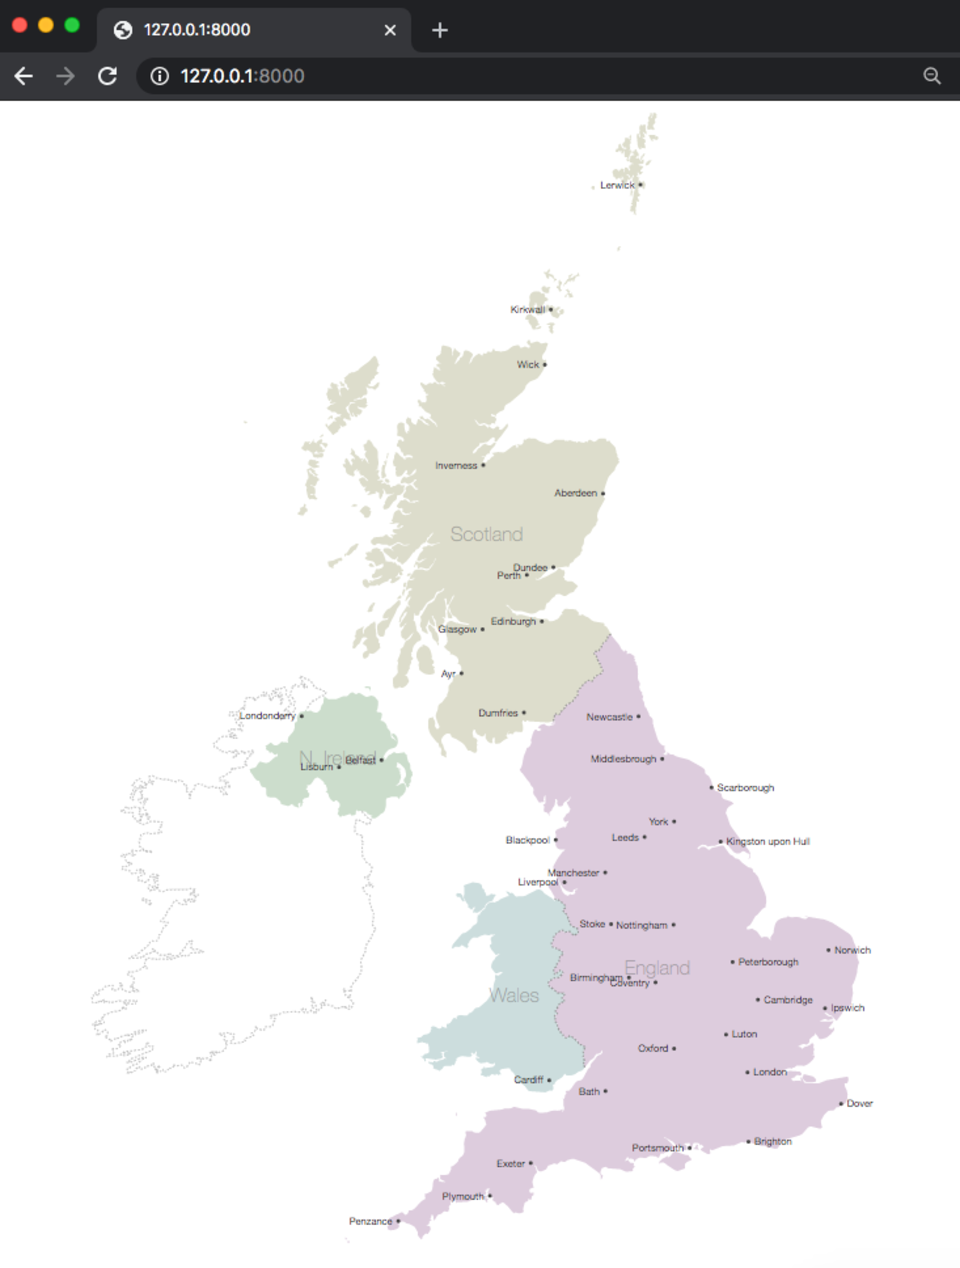 Fig 9. UK Map drawn by D3.js
Now we have a map rendering, we need some code to fetch our points from Rockset. To do this we’re going to write a function that will fetch the last 10 rows from our Rockset collection by calling the Rockset API.
function fetchPoints(){

  // initialise SQL request body using postman example
  var sql = '{ "sql": { "query": "select * from commons.\\"tesla-location\\" order by _event_time LIMIT 10","parameters": [] }}'

  // ask D3 to parse JSON from a request.
  d3.json('https://api.rs2.usw2.rockset.com/v1/orgs/self/queries')
    // setting headers the same way we did in Postman
    .header('Authorization','ApiKey AAAABBBBCCCCDDDDEEEEFFFFGGGGG1234567')
    .header('Content-Type','application/json')
    // Making our request a POST request and passing the SQL statement
    .post(sql)
    .response(function(d){
      // now we have the response from Rockset, lets print and inspect it
      var response = JSON.parse(d.response)
      console.log(response);
      // parse out the list of results (rows from our rockset collection) and print
      var newPoints = response.results
      console.log(newPoints)
    })
}
When calling this function and running our HTTP server we can view the console to look at the logs. Load the webpage and then in your browser find the console. In Chrome this means opening the developer settings and clicking the console tab.
You should see a printout of the response from Rockset showing the whole response object similar to that in Fig 10.
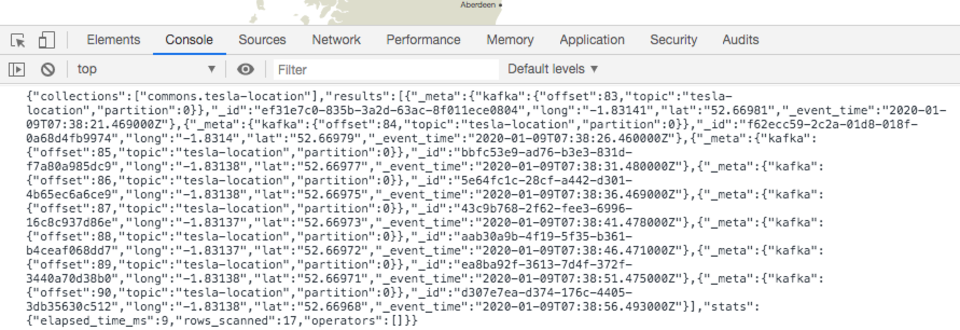 Fig 10. Rockset response output
Below this should be our other log showing the results set as shown in Fig 11. The console tells us that it’s an Array of objects. Each of the objects should represent a row of data from our collection as seen in the Rockset console. Each row includes our Kafka meta, rockset ID and timestamp and our lat long pair.
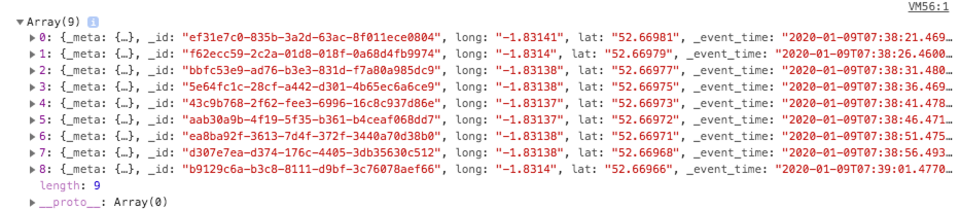 Fig 11. Rockset results log
It’s all coming together nicely. We now just need to parse the lat long pair from the results and get them drawn on the map. To do this in D3 we need to store each lat long within their array with the longitude in array index 0 and the latitude in array index 1. Each array of pairs should be contained within another array.
[ [long,lat], [long,lat], [long,lat]... ]
D3 can then use this as the data and project these points onto the map. If you followed the example earlier in the article to draw the UK map then you should have all the boilerplate code required to plot these points. We just need to create a function to call it ourselves.
I’ve initialised a javascript object to be used as a dictionary to store my lat long pairs. The key for each coordinate pair will be the row ID given to each result by Rockset. This will mean that when I’m polling Rockset for new coordinates, if I receive the same set of points again, it won’t be duplicated in my array.
{
    _id : [long,lat],
    _id : [long,lat],
    …
}
With this in mind, I created a function called updateData that will take this object and all the points and draw them on the map, each time asking D3 to only draw the points it hasn’t seen before.
function updateData(coords){

    // grab only the values (our arrays of points) and pass to D3
    var mapPoints = svg.selectAll("circle").data(Object.values(coords))

    // tell D3 to draw the points and where to project them on the map
    mapPoints.enter().append("circle")
    .transition().duration(400).delay(200)
    .attr("cx", function (d) { return projection(d)[0]; })
    .attr("cy", function (d) { return projection(d)[1]; })
    .attr("r", "2px")
    .attr("fill", "red")

}
All that’s left is to change how we handle the response from Rockset so that we can continuously add new points to our dictionary. We can then keep passing this dictionary to our updateData function so that the new points get drawn on the map.
//initialise dictionary
var points = {}

function fetchPoints(){

  // initialise SQL request body using postman example
  var sql = '{ "sql": { "query": "select * from commons.\\"tesla-location\\" order by _event_time LIMIT 10","parameters": [] }}'

  // ask D3 to parse JSON from a request.
  d3.json('https://api.rs2.usw2.rockset.com/v1/orgs/self/queries')
    // setting headers the same way we did in Postman
    .header('Authorization','ApiKey AAAABBBBCCCCDDDDEEEEFFFFGGGGG1234567')
    .header('Content-Type','application/json')
    // Making our request a POST request and passing the SQL statement
    .post(sql)
    .response(function(d){
      // now we have the response from Rockset, lets print and inspect it
      var response = JSON.parse(d.response)
      // parse out the list of results (rows from our rockset collection) and print
      var newPoints = response.results

      for (var coords of newPoints){
          // add lat long pair to dictionary using ID as key
          points[coords._id] = [coords.long,coords.lat]
          console.log('updating points on map ' + points)
          // call our update function to draw points on th
          updateData(points)
      }
    })
}
That’s the base of the application completed. We simply need to loop and continuously call the fetchPoints function every 5 seconds to grab the latest 10 records from Rockset so they can be added to the map.
The finished application should then perform as seen in Fig 12. (sped up so you can see the whole journey being plotted)
Fig 12. GIF of points being plotted in real time
Wrap up
Through this post we’ve learnt how to successfully request real time location data from a Tesla Model 3 and add it to a Kafka topic. We’ve then used Rockset to consume this data so we can expose it via the built in Rockset API in real time. Finally, we called this API to plot the location data in real time on a map using D3.js.
This gives you an idea of the whole back end to front end journey required to be able to visualise data in real time. The advantage of using Rockset for this is that we could not only use the location data to plot on a map but also perform analytics for a dashboard that could for example show trip length or avg time spent not moving. You can see examples of more complex queries on connected car data from Kafka in this blog, and you can try Rockset with your own data here.
Recommended Posts
Real Time Concert Ticket Recommendations with Rockset
| rockset | | realtime | | bigdata | | datascience |

The TRUTH about Tesla and Full Self Driving in the UK
| tesla | | model3 |