SAS Forum UK Customer Analytics
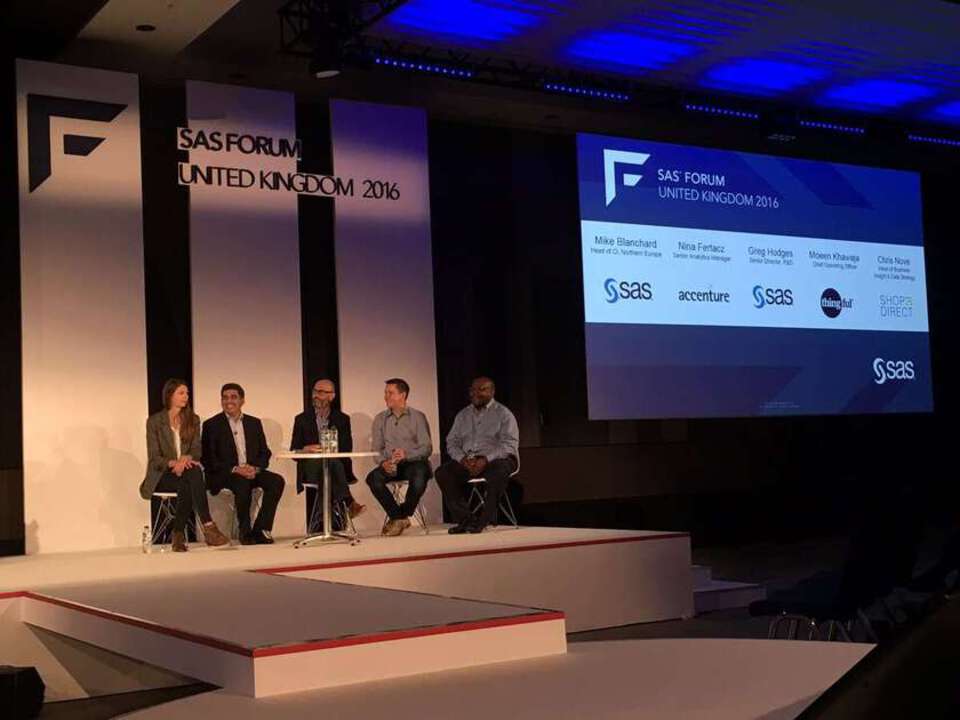 Image taken from Twitter
This post will explore the second day of conferences - make sure you check out the previous day too. The main theme was around Customer Intelligence. How do you monitor customer events? How do you better understand how your customers feel? How do you improve and tailor each customers experience?
Keynote: SAS Customer Intelligence 360
The main goal of SAS CI is to monitor customer events. The main differentiator between this and Google Analytics for example, is that the tool allows you to dig deeper and track even the smallest of customer interactions. This includes what part of the webpage have they seen, what buttons have they clicked and what fields they have filled in.
The tool takes this further by allowing you to then perform analytics on these events. It can automate what content show a specific customer based on other customers that have the same profile. It can also modify what a customer sees based on the content that gets the best customer response(e.g. most clicks of the buy button).
For example - you can use CI 360 to dynamically change what image of an item of clothing to show a customer based on how often customers click buy when that image is displayed. Obviously the outcomes change based on different segments of customers, so this will also allow you to show customer group X one picture and Y another based on how their demographically similar customers behave.
 Image taken from Twitter
This obviously is a leap forward in providing analytics to help personalise a customers experience. In the future they are looking to enhance the product to not only work using digital data but other data channels including social media or phone calls.
They followed this up with a deeper dive into SAS CI 360 going into a little more detail of what was discussed above.
Streaming Analytics and IoT
SAS have built their own streaming product called ESP (Event Stream Processing). It follows the usual model of publish and subscribe however between the publisher and subscriber, there is an engine that allows you to enrich event data, run models on the events or apply business rules. These actions then create Complex Events that can be sent to the subscriber to be visualised, analysed or reported more efficiently.
ESP again runs in the cloud and is built to be very performant. It was built using C++ and brings the data into memory to gain the best performance. They quoted a benchmark that stated that it could run a KMeans model on 3.5 million events in one second, which is pretty impressive.
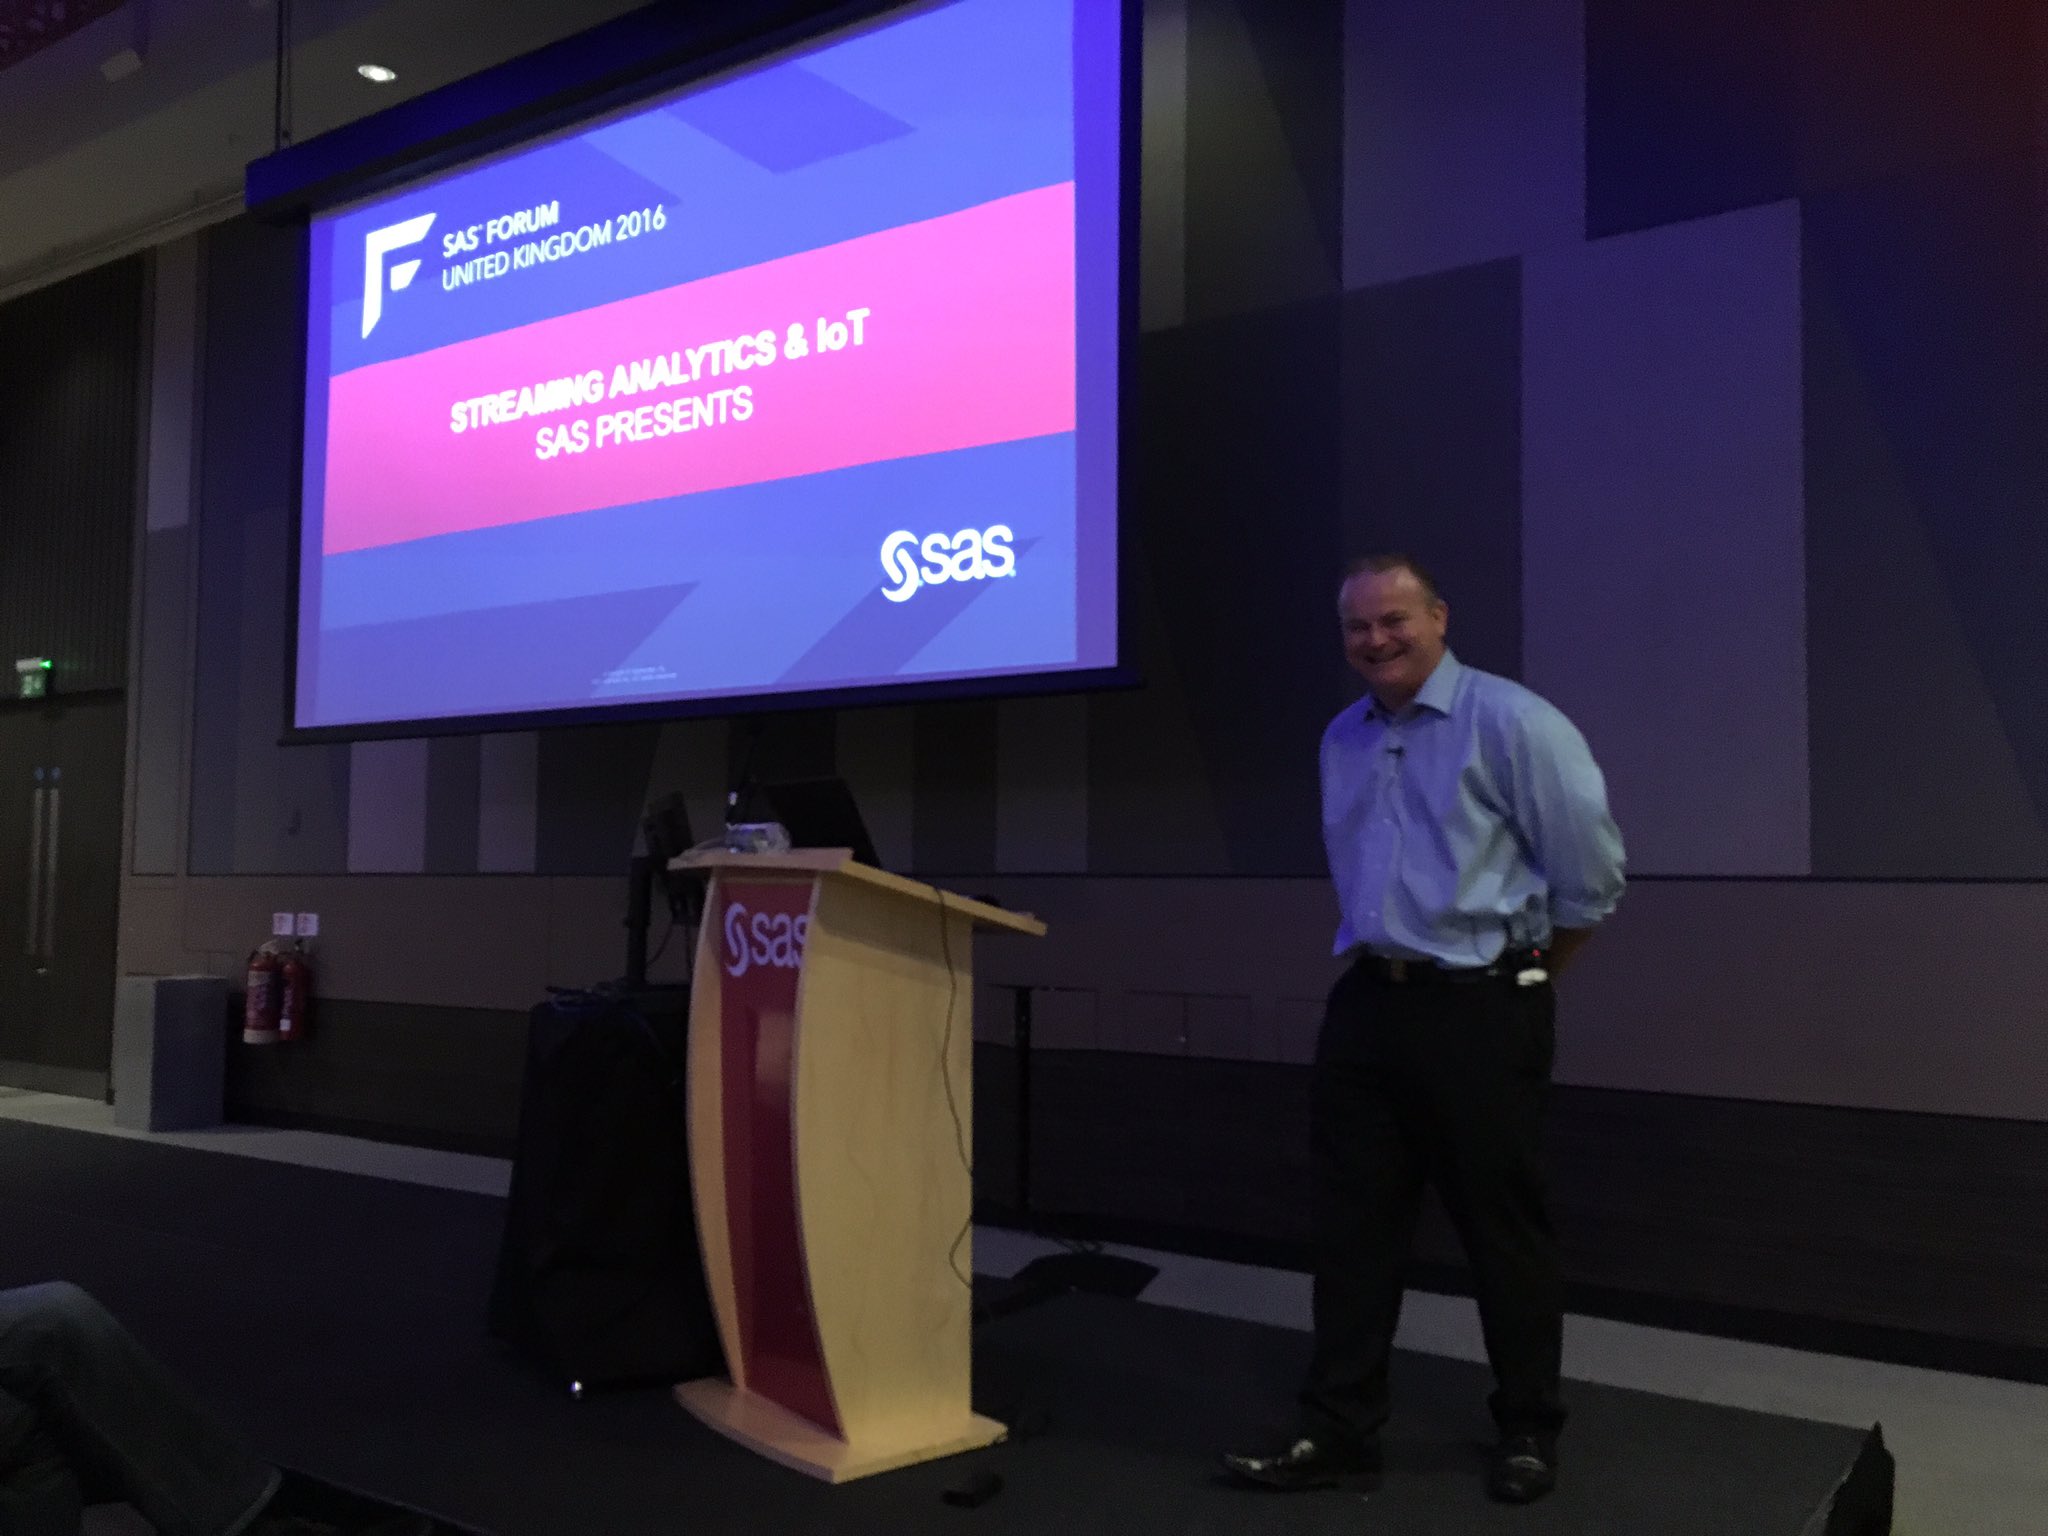 Image taken from Twitter
Identity Row Level Security
This session was another session hosted by RBS. They have 1,300 users so needed a way to secure their customer records at a row level. Based on the users priviledges, they either get a specific row returned or not when performing queries.
To do this there is essentially a security database that holds certain roles and access levels. This database is merged with data stored within tables and what I pictured as a “virtual column” is added to the table stating the access level for each row. On selection of the data, a hidden where clause is essentially used to ignore all rows that dont match the current users access levels.
Wrap Up
Overall it was a really interesting 2 days of conferences, especially for someone who has never used SAS as a tool. My parting thoughts were that, although many of the capabilities provided by SAS could be replicated by other open source tools - the level of abstraction and simplicity provided means these capabilities are available to users of any technical level, making it a very tempting proposition.
As with anything that gives you such rich functionality, it comes at a price. I will be interested to see how their pricing and licensing models changed with the introduction of SAS Viya and their cloud platform offering.
Recommended Posts
SAS Forum UK The Launch of Viya
| conference | | machinelearning | | sas |
 Image taken from twitter
How to Scale Spark Streaming Applications
| bigdata | | streaming | | spark |