
How to Build a Fast Data Warehouse with Amazon Redshift
 Data Warehousing: Simplified
On the surface, it may seem like a lot has changed in recent years in regards to data collection, storage and warehousing. The introduction and takeover of NoSQL, “Big Data”, Graphing and Streaming technologies may appear to have changed the landscape, but there are some fundamentals that remain.
In my current role, we use Amazon Redshift for our data warehousing. However, whether we built a traditional data warehouse using Oracle or a data lake in Hadoop, the core architecture would remain the same.
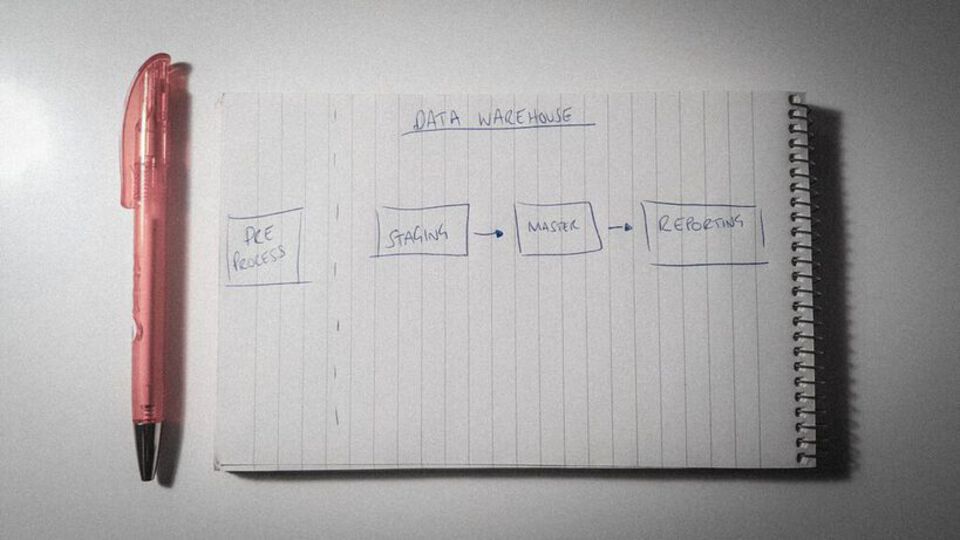
The core architecture boils down to some preprocessing and three separate areas (schemas if you’re using redshift) called Staging, Master and Reporting. In this post I’ll talk through each in detail.
Preprocessing
Unfortunately, not all data is created equally, but it’s data nonetheless and therefore carries value.
In order to deal with the complexities of external data, some pre-processing is almost inevitable, especially when collection from a number of different sources. The main goal of the pre-processing step is to get the data into a consistent format that can be loaded by the data warehouse.
This includes, but isn’t limited to:
- Converting Excel spreadsheets to CSV
- Parsing JSON data (we tend to process each object onto one row in a single column and let Redshift parse it, but you could parse it upfront too)
- Cleaning up bad or erroneous data files
Once ready, you will need a central place to put these files ready for loading into the data warehouse.
One example could be putting all files into an Amazon S3 bucket. It’s versatile, cheap and integrates with many technologies. If you are using Redshift for your data warehouse, it has great integration with that too.
Staging
The staging area is the bread and butter to any data warehouse.
A good data warehouse takes data from many different sources. Each data source comes with its own nuances, styles and naming conventions.
The staging area is the place to bring all this in — most likely from where you put it after pre-processing (but not always) — and store it transiently until it’s processed further down the line.
Like the loading area at an actual warehouse. The place where freights unload isn’t the final destination or final form of the materials or products. It’s just a holding area.
 on [Unsplash](https://unsplash.com?utm_source=medium&utm_medium=referral)](https://cdn-images-1.medium.com/max/800/0*TeBd_PdHORuGNbK2)
It simply allows you for the first time to have all the data within the bounds of the warehouse ready for further processing and modelling.
My personal opinion is that data in the staging area should be as close to raw as possible (again, you have to make some changes when pre-processing, but that shouldn’t change what the raw data tells you). You may even want to keep the original column names and table names the same. This makes it easier to trace back when investigating or reporting issues in the source.
The staging area should also be seen as transient.
You should retain data for a selected period of time in the staging area after which it should be purged. For example you might keep a rolling window of one months worth of data in case of failed loads or any other investigation.
This is the last point where the data should be thought of as raw. From this point forward the data should conform to the standards of the data warehouse.
Master
The master area is where the incoming data takes some real shape.
The master schema should contain correctly modelled tables, that are appropriately named. Column names should also be corrected along with their data types.
This makes the understanding of what tables are and what they hold easier, inherently improving usability. Just like the old school filing of documents.
 on [Unsplash](https://unsplash.com?utm_source=medium&utm_medium=referral)](https://cdn-images-1.medium.com/max/800/0*7dghOtqcHcAmU_dA)
When moving data from Staging into Master, thought should go into cleaning it, things such as:
- Standardising all date formats and time zones to be the same (where appropriate)
- Rounding numbers where appropriate to fewer decimal places
- Cleaning strings to maybe fix capitalisation or remove start and end white spaces
- Standardising addresses to be of the same format
- Splitting data out into multiple columns or extracting it from JSON
I would also give some time to ensuring that column names for columns that join, match.
For example, if you have user data from some web logs, your user data store in MongoDB and maybe some advertising data about users. These sources will all hopefully contain some unique user identifier. However they might not all call it the same thing.
By standardising the names of columns it then becomes so easy for you, or any other user of your data, to intuitively understand what data can be joined together.
As a data engineer this is the ultimate end goal.
You have data that is clean and appropriately named to match the business language, modelled correctly ready for any exploration or calculations to be done downstream.
Reporting
The base work is done. We’ve prepared and ingested, modelled and cleaned. We now want to expose our shiny new data to the world. This is where the reporting layer comes in.
At this point, if you are using a row based data warehouse in Oracle, you might build some fact tables and data marts. This is a perfectly reasonable use case for the reporting layer, as you can stick any decent reporting tool on top of it and you’d be good to go.
However, some of these traditional data warehousing techniques have efficiency in mind the suit row based storage solutions like Oracle. These systems are efficient at joining data but rows with many columns are inefficient, mainly because of the row based approach having to deal with the entire row, even if only a few columns are required for the query.
If you are using a columnar based data warehouse like Amazon Redshift, your approach should be different. Redshift doesn’t mind wide tables and denormalising dimensions and facts onto one table is preferred over multiple dimensions.
The benefits of modelling your data this way when using Redshift include:
- Improved efficiency as Redshift is happier dealing with wide tables than it is with lots of joins.
- Ease of use for end users or analysts that aren’t as data model savvy as they don’t have to battle with joins.
- It’s easier to query as all the data required for the reported entity is in one place.
 on [Unsplash](https://unsplash.com?utm_source=medium&utm_medium=referral)](https://cdn-images-1.medium.com/max/800/0*_NhOfQtIkmObNdue)
For example, lets say you want to report on your customers. You have a customer table, an order table, marketing log table and some web analytics data within your squeaky clean Master layer.
In Redshift, within the Reporting layer you would build a Customer table. This would hold any standard customer data (minus their personal details, as they shouldn’t be required for reporting) such as their registration date, maybe a postcode, etc.
You could pull in whether they registered on a mobile device, or maybe whether they’ve installed your smartphone app or desktop app.
You could join the order data and build some fact columns such as, total spent to date, first order date, last order date, number of orders.
The marketing table you would do the same and create some relevant facts like number emails sent, opened and clicked etc.
From the web analytics you might pull in their last website visit date, their favourite device, most common device type (desktop, mobile, etc.) etc.
You get the picture.
 on [Unsplash](https://unsplash.com?utm_source=medium&utm_medium=referral)](https://cdn-images-1.medium.com/max/600/0*_3MCKyHMuzLCC8aa)
All of this results in a super wide customer table with all the relevant dimensions and facts. Your analysts can use this to calculate everything from acquisition rates, shift in device usages across your customer base, high value customers (and any commonalities among them), customer churn and engagement and a whole lot more.
All of this from one place, with no joins and most of the heavy lifting done as it should be done, using the power of the data warehouse.
Data warehouses don’t tend to be cheap and are literally designed to crunch data. Make the most out of it, do as much as you can here. Free your analysts to dig out insights instead of waiting for the less beefy reporting server to do the hard work.
You might find that more than just the analysts are willing to use it, if you make it easy and quick enough.
In Summary
Following this simple approach I believe you can build a fully functioning data warehouse thats not just easy to expand, but also understand.
You may want to think of your Staging, Master and Reporting layers as logical things. This may work for you. I prefer to keep them physically separate as it not only feels cleaner, but allows you to restrict what the end users can use and see from the previous states.
Recommended Posts
AWS VPC Overview
| cloud | | aws |

Why I’m sick of ETL tools and what I use instead (hint, it’s a different ETL tool)
| datapipeline | | aws | | datawarehouse | | bigdata |
In my previous post I talked about how to architect your data warehouse, especially if you’re using Amazon Redshift.